
The Brutal Truth About Prop Firm Pass Rates: What the Data Actually Shows
An evidence-based breakdown of why 90%+ of traders fail — and what the 3% who succeed do differently.
The prop trading industry made a massive $15 billion bet: that retail traders would pay out-of-pocket fees to prove their skills on simulated accounts.
They were right. Over 2 million evaluation challenges are bought every single year. Monthly global search volume for "prop firm" exploded from a mere 880 monthly searches to a massive 49,500 monthly searches — a 56x surge in consumer demand. Today, more than 1 million retail traders globally hold or have held a funded account.
But underneath the sponsored Instagram posts, luxury car flexes, and photoshopped payout screenshots lies a far more sobering picture. The hard data — sourced from public firm disclosures, independent research, and large-scale algorithmic account studies — tells a story that corporate marketing departments desperately don't want you to read.
The Numbers: A Sector-Wide Reckoning
Let's establish the hard mathematical floor first.
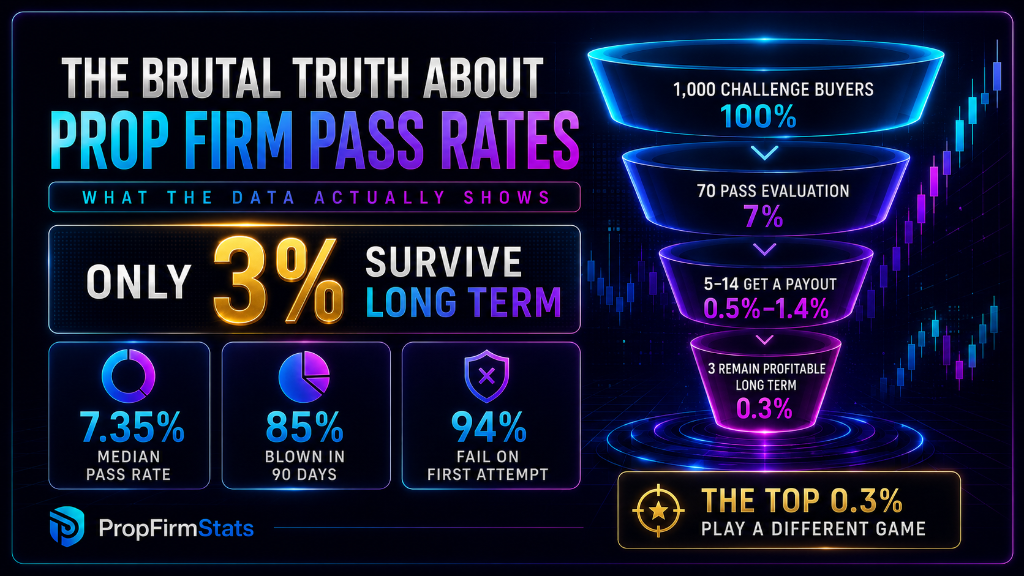
Multiple independent data pools — including documented QuantVPS research, historical datasets from FunderPro, and pre-shakeout disclosures from major firms — converge on an identical, brutal range: only 5% to 10% of retail traders pass an initial prop firm evaluation phase. Audited historical tracking reveals a precise baseline: just 7.35% of all challenge participants successfully pass to funded status.
Unfortunately, the weeding-out process gets significantly worse after a trader passes the evaluation.
The Combined Reality Filter
| Trading Evaluation Stage | Statistical Survival Rate | Source Dataset |
|---|---|---|
| The Evaluation Phase | 5%–10% (7.35% Median) | FunderPro & Firm Disclosures |
| The Payout Phase | 7%–20% of Funded Traders | QuantVPS Analytics |
| The 90-Day Survival Rate | 15% Account Longevity | Gitnux Verified Finance Data |
| Long-Term Sustainability | Under 3% of Total Sign-ups | Sector-Wide Consolidated Study |
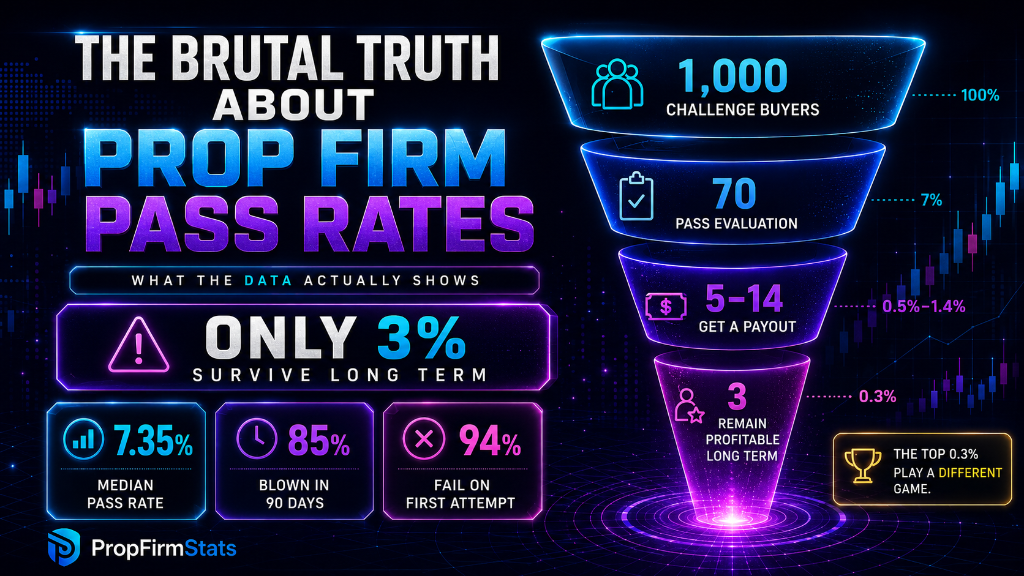
To put this in human terms: if 1,000 retail traders all buy a prop challenge today:
- ✓Roughly 70 will pass the initial assessment
- ✓Between 5 and 14 will ever survive long enough to secure a single live withdrawal
- ✓Perhaps 3 individual traders will still have an active, profitable account 12 months from today
Data verified via Gitnux metrics indicates that 85% of funded accounts are completely blown within their first 90 days of going live. The industry-wide average lifespan of a funded account is a microscopic 4 months.
A macro-study analyzing over 300,000 distinct trading accounts confirmed a 94% first-attempt failure rate before the funded-stage filter even applied.
Why Traders Fail: Breaking Down the Risk Architecture
The mathematical data is unusually clear about why failure happens. It is almost never a failure of technical trading edge or strategy. It is a direct result of falling into traps intentionally engineered by the firm's strict risk framework.
1. Drawdown Violations — The Absolute Killer (70%)
Statistical analysis shows that overall drawdown violations cause 70% of total account terminations. A separate dataset confirms that 75% of those losses are caused directly by daily drawdown rule breaches.
Most firms enforce a strict 5% daily drawdown and a capped 8% to 10% maximum trailing drawdown.
The Math Trap: If a trader risks 2% per trade, they need just 3 consecutive losses to instantly breach their daily limit. Risk 3% per trade, and 2 bad calls ends your funded career in an afternoon.
2. Overleveraging — A 90% Correlation With Failure
Audited trading datasets attribute 90% of all prop firm evaluation failures directly to overleveraging. This compounds seamlessly with the drawdown problem.
The math is stark:
- ✓A disciplined trader risking 0.5%–1% per trade must lose 10–20 consecutive positions to breach a 10% drawdown ceiling
- ✓A reckless trader risking 3% per trade requires only 4 consecutive losses to destroy their account
3. Psychological Breakdown & Urgency Manufacturing
Data shows that 89% of active retail traders describe the evaluation phase as highly stressful. The challenge format naturally manufactures desperate behavioral patterns:
- ✓The Sunk Cost Effect: Real capital is on the line via the non-refundable evaluation fee
- ✓The Desperation Sprint: Profit targets create a psychological finish line that triggers urgency-driven over-sizing
Behavioral data from the 300,000-account study confirms that account failures cluster in two windows: immediately following a heavy losing session (revenge trading) and during the final days of trying to force a target (desperation sizing).
4. Technical Failures & Execution Slippage
92% of active traders reported experiencing major technical issues during an active challenge — execution delays, spread widening during news, platform instability. These events disproportionately eliminate traders using ultra-tight stops, where just 2–3 pips of negative slippage can push an otherwise acceptable trade into a rule disqualification.
5. Rule Complexity: The Hidden Fine Print Filters
Most challenge buyers only read the headline requirements. Far fewer review the complex edge cases that act as silent account filters:
- ✓Correlated Instrument Restrictions: Concurrent EURUSD and GBPUSD positions counted as a single risk violation
- ✓Consistency Clauses: No single trading day can represent more than 40% of total profit accumulated
- ✓News-Event Traps: Strict 3–5 minute execution bans around major macroeconomic data drops
The Verification Phase: The Forgotten Trap
The initial challenge is merely Phase 1. The Verification Phase (Phase 2) is where thousands of surviving traders immediately unravel.
Audited performance metrics reveal a 65% breach rate during the Verification stage. Traders who successfully pass Phase 1 frequently overfit their strategy to the exact market conditions of that specific window. When Phase 2 encounters a shift in market environment, a lack of adaptability combined with lingering high-leverage habits triggers a second wave of liquidations.
Conversely, platforms like Take Profit Trader have historically reported a significantly higher evaluation pass rate of 20.37% — explicitly proving that firm parameters directly dictate your probability of success.
To see how your current firm's rules stack up mathematically against the industry average, check out our comprehensive Prop Firm Comparison Tool to audit your risk metrics before buying your next challenge.
The Profile of the 6%: How Successful Traders Survive
Data tracking across the profitable minority outlines a highly consistent operational profile of the top 6% of funded traders:
1. They Risk Less Than You Think Profitable funded traders consistently maintain a risk per position of 0.5% to 1.0% of total account equity — never 2%–5%. This "boring" approach guarantees that a single losing day cannot trigger a daily drawdown lockout.
2. They Trade Infrequently Overtrading is cited as a primary failure trigger across every major analytics engine. Elite funded traders are highly selective and treat zero-trade days as a victory.
3. They Erase the Transition Gap The jump from demo evaluation to live funded account triggers a massive behavioral shift in failing traders. The 6% alter absolutely nothing about their setup, pacing, or execution sizes when moving to a live account.
4. They Maintain Live Journals Traders who systematically log entries, exits, psychological metrics, and risk parameters identify the exact boundaries where they historically violate drawdown limits — and avoid them.
The Industry Shift: Fees vs. Performance
Historically, the legacy prop firm model was overwhelmingly fee-driven. Traders paid $100–$500 per challenge, 90%+ failed, and application fees funded the small minority of payouts. This model caused an unsustainable boom with a 45% CAGR.
This structural imbalance triggered a massive market correction. Intelligence assessments reveal that between 80 and 100 prop firms completely vanished. High-profile regulatory actions — such as the landmark enforcement against MyForexFunds — served as a terminal warning shot.
What remains today is a leaner, highly institutionalized landscape. The firms built for long-term survival have shifted their economics toward genuinely producing profitable traders, because their backend profit-split framework only scales when traders extract actual capital from live liquidity providers.
The Bottom Line
The prop firm sector has matured into a multi-billion dollar financial powerhouse. The underlying promise — prove you can manage risk, and we will grant you access to institutional-grade purchasing power — is completely real. But the path is intentionally demanding.
The 94% failure rate does not imply the funding model is inherently broken. It proves that the bar for professional risk management is extraordinarily high. The elite 6% who achieve long-term withdrawals do not possess secret trading strategies. They possess institutional-grade habits, flawless execution discipline, and absolute respect for the math behind drawdown limits.
Audited Data Sources
- ✓QuantVPS Performance Analytics Engine (Consolidated Dataset)
- ✓FunderPro Historical Institutional Disclosures
- ✓Gitnux Financial Metrics & Prop Industry Report
- ✓Finance Magnates Intelligence Market Briefings
- ✓PickMyTrade 300,000-Account Algorithmic Tracking Study
- ✓Take Profit Trader Process Evaluation Audits
PropFirmStats is an independent comparison and research platform. This article is for educational purposes only and does not constitute financial advice. Always verify firm rules directly before purchasing a challenge.
Get Firm Reviews and Discount Codes
Be the first to know when we publish new prop firm reviews and exclusive discount codes. No spam, unsubscribe anytime.